
Analysis of IOC Stock Price Movement and Future Outlook
A steady outlook with potential for growth, driven by strategic investments and increasing demand in the energy sector.
Analysis of IOC Stock Price Movement and Future Outlook
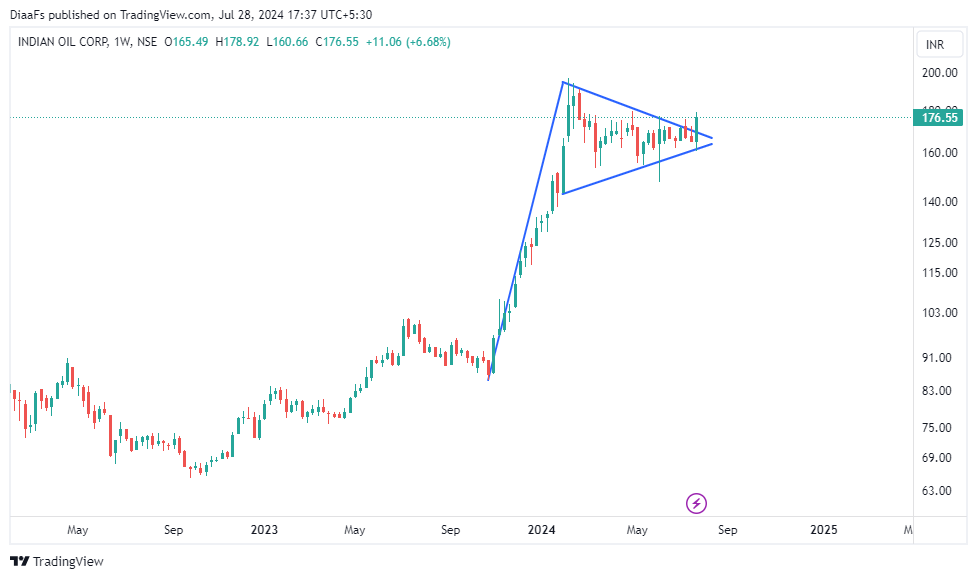
In recent months, the stock price of Indian Oil Corporation (IOC) has exhibited a noteworthy trajectory, demonstrating a strong upward trend followed by a period of consolidation. This pattern of movement not only underscores the stock's past performance but also provides significant insight into its future potential.
IOC stock has shown remarkable growth, with its price increasing from approximately 86 levels to around 196 levels. This sharp rise in such a short span indicates a strong bullish sentiment and robust investor confidence in the company's fundamentals and market prospects. The ascent from 86 to 196 levels represents a substantial gain, reflecting the stock's strong performance and the positive momentum driving its price.
After reaching the 196 levels, the stock entered a phase of consolidation starting from February 2024. This consolidation phase has been characterized by a relatively stable price movement within a defined range, rather than further upward or downward swings. Consolidation periods are often seen as a natural part of a stock's price cycle, providing a necessary pause after a significant move to allow for stabilization and to absorb market fluctuations.
When analyzing this price behavior from a technical perspective, the combination of the sharp upward move followed by a consolidation phase forms what is known in technical analysis as a "flag pattern." A flag pattern is a continuation pattern that typically indicates a brief period of consolidation before the previous trend resumes. In this case, the flag pattern suggests that the stock, after a strong upward surge, is poised for another leg up following the consolidation period.
Recently, IOC stock has given a breakout from this flag pattern, signaling a potential resumption of the bullish trend. A breakout occurs when the stock price moves beyond the upper boundary of the consolidation range, confirming the end of the consolidation phase and the beginning of a new upward movement. This technical signal is often interpreted by investors as an indication of further potential gains.
Given the recent breakout from the flag pattern, the stock is now positioned for a potential rise towards new highs. The target price based on this technical analysis is projected to reach 300 levels. This target is derived from the anticipated continuation of the upward trend that has been established and reinforced by the recent breakout.
At the current trading levels of 177, the stock appears to offer an attractive entry point for investors. The rationale behind this investment opportunity includes not only the recent breakout but also the overall positive outlook based on historical performance and technical indicators. To manage risk effectively, it is prudent to set a stop-loss level. A stop-loss of 144 provides a safeguard against significant downside risk, ensuring that potential losses are limited if the market moves unfavorably.
In summary, the IOC stock has demonstrated a strong upward movement from 86 to 196 levels, followed by a consolidation phase forming a flag pattern. The recent breakout from this pattern suggests a favorable outlook for the stock, with the potential to rise towards 300 levels. Buying the stock at the current levels of 177, with a stop-loss set at 144 and a target price of 300, appears to be a strategic investment approach, offering a promising opportunity for growth while managing risk effectively.
I specialize in identifying stocks with the potential for substantial gains, often targeting returns of 50%, 100%, or even more than 200%. My service includes thorough research and analysis to pinpoint promising stocks, providing detailed recommendations with buy levels, stop-loss points, and target prices. I also offer ongoing support to guide you until the investment yields results.
For a modest fee, you can access these carefully curated stock suggestions and benefit from my expertise. To see examples of my successful past recommendations, feel free to review my previous posts. Subscribe now to receive tailored stock recommendations directly to your inbox and stay ahead in your investment journey.